Large Scale vs Small Scale Charts: What’s The Difference?
When you are navigating on the water, you’re going to need multiple charts showing the same location, just at different scales.
You’ll want a mix of “large-scale charts” and “small-scale charts”.
Small-scale charts show a much larger geographical area with far less detail, while large-scale charts show a much smaller geographical area with a far greater level of detail.
| Small-Scale | Large-Scale |
|---|---|
| e.g. 1:1,500,000 | e.g. 1:5,000 |
| Large geographical area (e.g. an ocean) | Small geographical area (e.g. a harbour) |
| A smaller level of detail | A greater level of detail |
Pro Tip: It is easy to remember by thinking what size of paper would be needed to print the chart. A small-scale chart of an ocean could be printed on a smaller sheet of paper, while a large-scale chart of the same ocean would need a much larger piece of paper.
A great example of a small-scale chart is NOAA chart 530 which covers much of the North Pacific Ocean at a scale of 1:4,860,700.
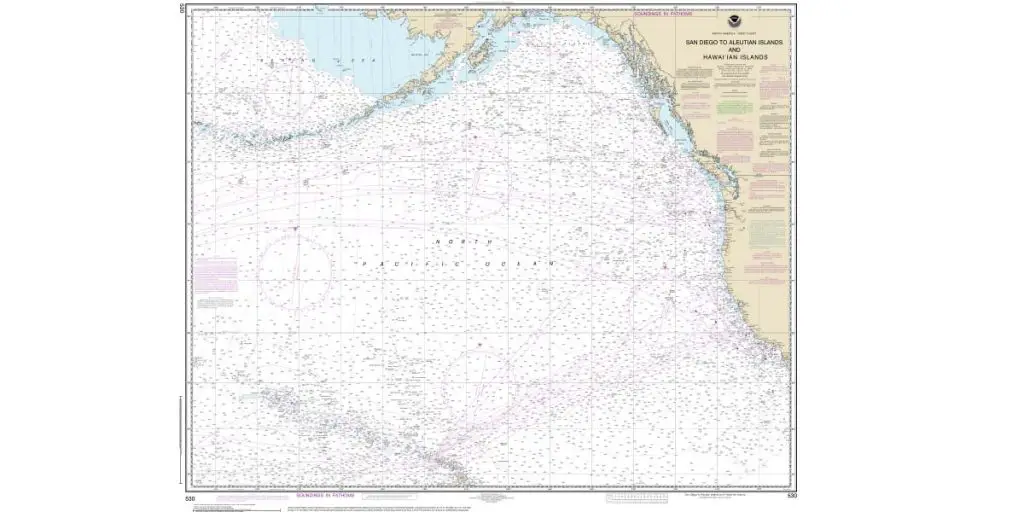
You can see that it covers a large geographical area, resulting in fewer details being shown.
Contrast with this large-scale chart, NOAA chart 12338, covering Newtown Creek in New York Harbour at a scale of 1:5,000.
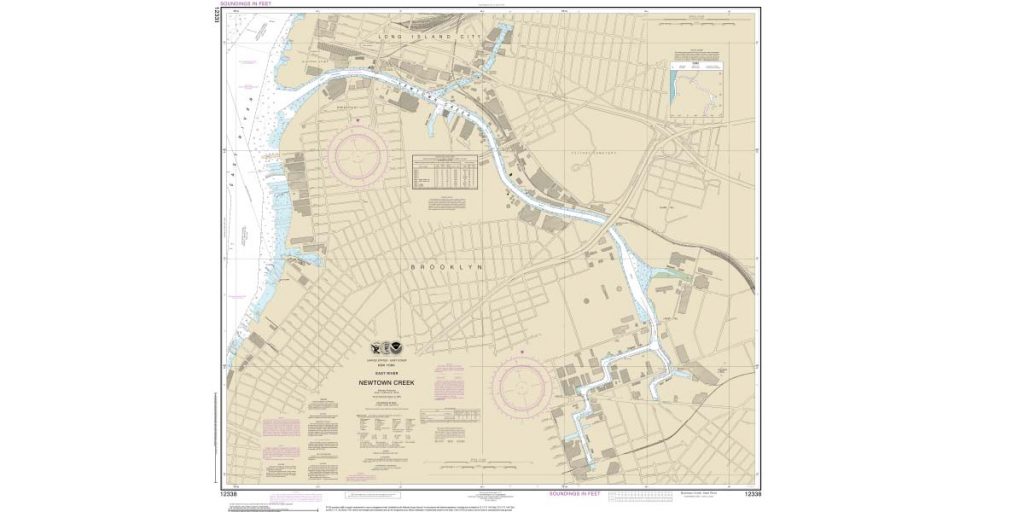
You can see this it covers a much smaller geographical area, meaning that you can see a much greater amount of detail.
On large-scale charts, it is much easier to see things like light, navigational marks and details about the nature of the seabed.
Read More: I have an entire article where you can find out about the symbols and abbreviations used to show the nature of the seabed: Nautical Chart Symbols & Abbreviations: Nature Of Seabed.
Chart Scales Are Relative
Although small-scale charts cover a larger geographical area, and large-scale charts cover a smaller geographical area, there is no hard-and-fast definition of what a small-scale or large-scale chart actually is.
Small-scale and large-scale are relative terms, used to describe how two different charts compare, relative to each other.
You can describe a chart of 1:500,000 scale as being a larger scale chart than one at 1:5,000,000.
You could also describe the same 1:500,000 scale chart as being a smaller scale chart than one at 1:10,000.
Fortunately, however, when it comes to nautical charts, we do have categories that could allow us to apply some absolute terms to the charts at the extremes.
Nautical Charts Are Categorised Into 6 Different Scales
Nautical charts are broadly split into 6 different categories, designed to facilitate safer navigation by making it easier for you to purchase a chart at the correct scale for the purpose you require.
Please note: the scales that I have given are rough scales, as national hydrographic organisations will all use their own scales and definitions for the boundaries between chart types.
| Name | Use | Scale |
|---|---|---|
| Berthing | Manoeuvring alongside a berth | > 1:5,000 |
| Harbour | Navigating within a port or river. | 1:5,000 – 1:25,000 |
| Approach | Navigating toward a port | 1:25,000 – 1:75,000 |
| Coastal | Navigating near the coast | 1:75,000 – 1:350,000 |
| General | Navigating an ocean | 1:350,000 – 1:1,500,000 |
| Overview / Sailing | Planning a complete route (e.g. across an ocean) | < 1:1,500,000 |
You could reasonably argue that a berthing chart is a large-scale chart, as there are no nautical charts available at a larger scale.
Similarly, you could argue that an overview chart is a small-scale chart because that is the smallest possible scale available.
With charts in the middle, however, you are back to using the term relatively. A coastal chart is a smaller scale than an approach chart, but it is a larger scale than a general chart.
Berthing
Typical Scale: > 1:5,000 (large scale chart)
A berthing chart is typically produced by a harbour authority and would show a sufficient level of detail for manoeuvring a vessel alongside a berth.
For example, a marina might publish a berthing chart showing the location of the fuel pontoon and visitor berths.
Harbour
Typical Scale: 1:5,000 – 1:25,000
A harbour chart is typically the largest scale chart regularly produced by a national hydrographic organisation.
They are designed to show a sufficient level of detail for navigating within a harbour, river, anchorage, port, or other restricted areas.
Approach
Typical Scale: 1:5,000 – 1:75,000
An approach chart is designed to show an appropriate level of detail for navigating towards the entrance of a port or harbour.
On a large vessel, it is likely that you will be within the main shipping channels, possibly under the advice of a harbour pilot.
Coastal
Typical Scale: 1:75,000 – 1:350,000

A coastal chart is designed to be used for navigating close to the coast, but is unlikely to have a sufficient level of detail to plan an entry to one of the ports.
General
Typical Scale: 1:350,000 – 1:1,500,000
General charts are charts that are most suitable for navigating the majority of an ocean passage.
They have a sufficient level of detail for fixing your position and identifying hazards within a few miles of your track.
They are not suitable for navigating close to any hazards though.
Overview / Sailing Chart
Typical Scale: < 1:1,500,000 (small scale chart)
Overview charts are designed for general passage planning purposes as they show a large geographical area, but have a low level of detail.
They are good for planning a great circle track across an ocean and determining which general charts will be required for the passage.
In general, overview charts should not be used for navigation.
How To Choose The Best Scale Chart For Navigation
The best scale nautical chart to use is the largest scale available.
For example, as you approach the coastline, you might start by navigating on a general chart, but as soon as you are within the boundary of the coastal chart, you should switch across to that one.
Similarly, each time you cross the boundary into a different chart, you should switch across to that one so that you have the maximum amount of detail and all the available information for navigation.
When you are going the other way and leaving a harbour, you should switch up to the most appropriate one for looking ahead. There is no point in navigating at the edge of a chart and missing an upcoming danger.
You need to be able to see ahead on your track for a reasonable distance, yet still, be able to plot your position accurately enough to determine your proximity to dangers.
If there is a danger within 0.5M of your position, you want a chart that will allow you to plot your position accurately enough.
Read More: Measuring distances on a nautical chart is a key navigation skill. Check out this article where I show you how: How To Measure Distances On A Nautical Chart.