Chart Datums, Depths & Heights: An Illustrated Guide
Did you know that the soundings given on a nautical chart are not the depths of water that you can expect to measure?
This is because the soundings on a nautical chart are relative to the chart’s datum, rather than the water’s surface.
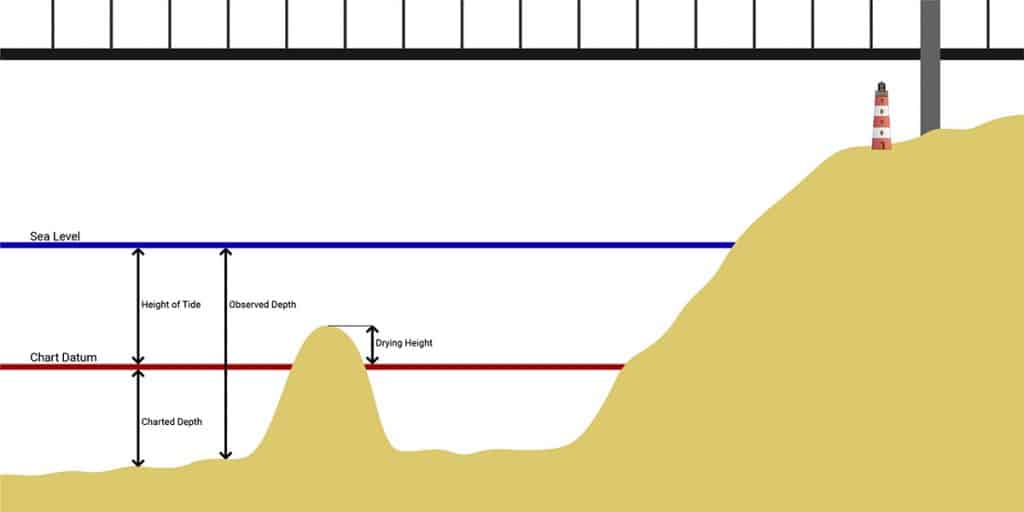
Occasionally, the datum will coincide with the water’s surface, but more often than not, there will be a difference between the two. The difference between the chart datum and sea level is the height of tide.
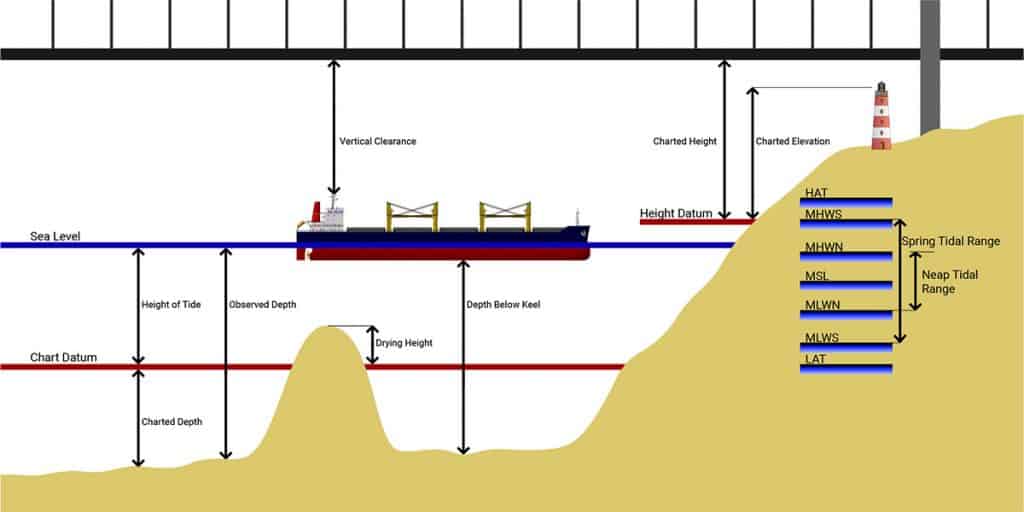
In the image above, you can see that the datum gives a single, consistent, reference line across the chart, from which all depths can be measured.
When the seabed is below the chart datum, the soundings on the chart will be positive. When the seabed is above the chart datum, soundings will be negative, indicating a drying height.
Despite its name, a drying height does not necessarily mean that the spot will dry out, it only means that it is above chart datum.
To determine where the sea level will actually be, you need to know the height of the tide, which you can find from tide tables.
Combining the height of tide, with the charted depth (or drying height) will give you an “observed depth”, literally the amount of water you expect to find.
Where To Find Chart Datum On A Nautical Chart
Unfortunately, there is not a common chart datum used across all nautical charts. Some might use the lowest astronomical tide, others may use mean sea level, while others could use mean lower low water.
Given the variation, you always need to check the datum in use on your chart to be able to use it properly.
Fortunately, it is easy to find as it will always be included in the textual information of the chart.
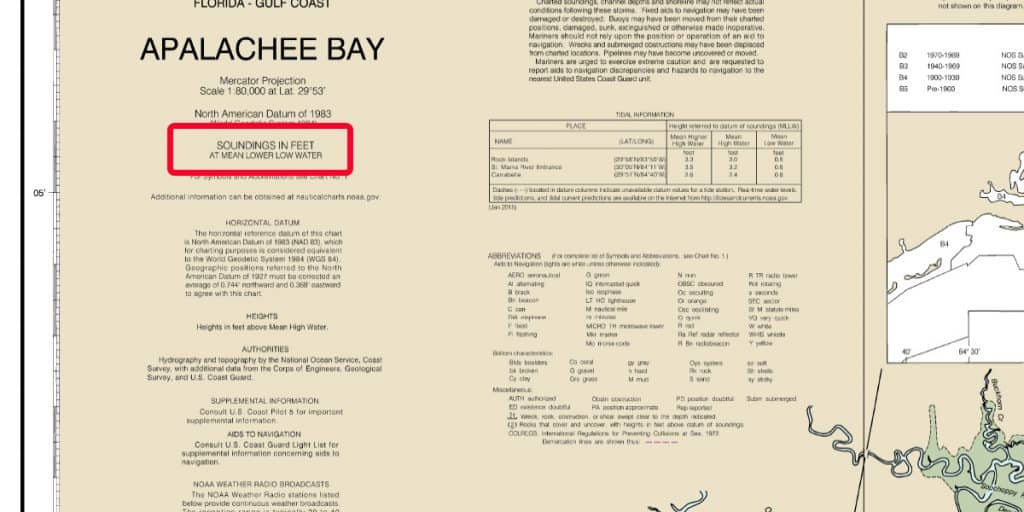
If you cannot find a note specifically telling you what the datum is, then you should look for information about the soundings instead.
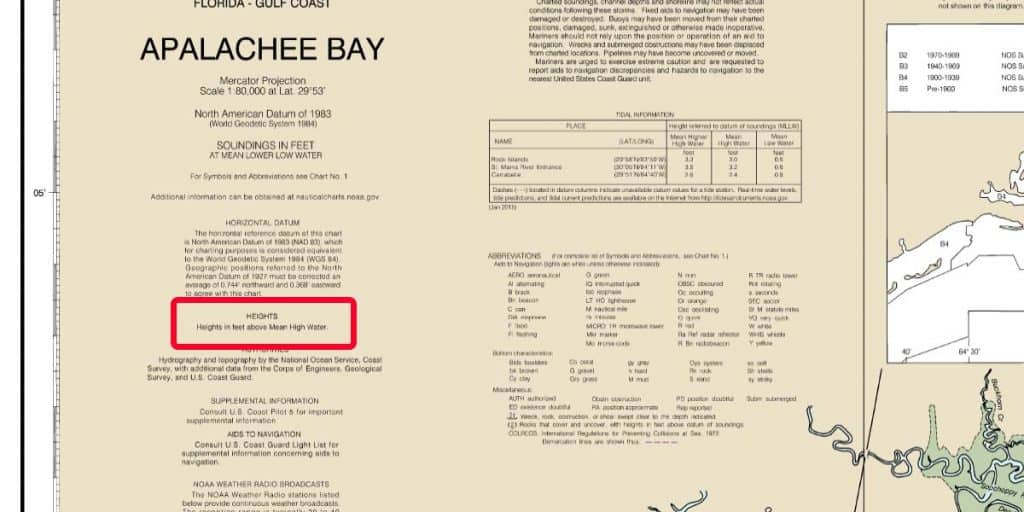
In the image above, it states:
“SOUNDINGS IN FEET AT MEAN LOWER LOW WATER”
Not only does it tell us that the chart’s datum is mean lower low water, but it also tells us the units are feet.
Abbreviations For Tidal Levels
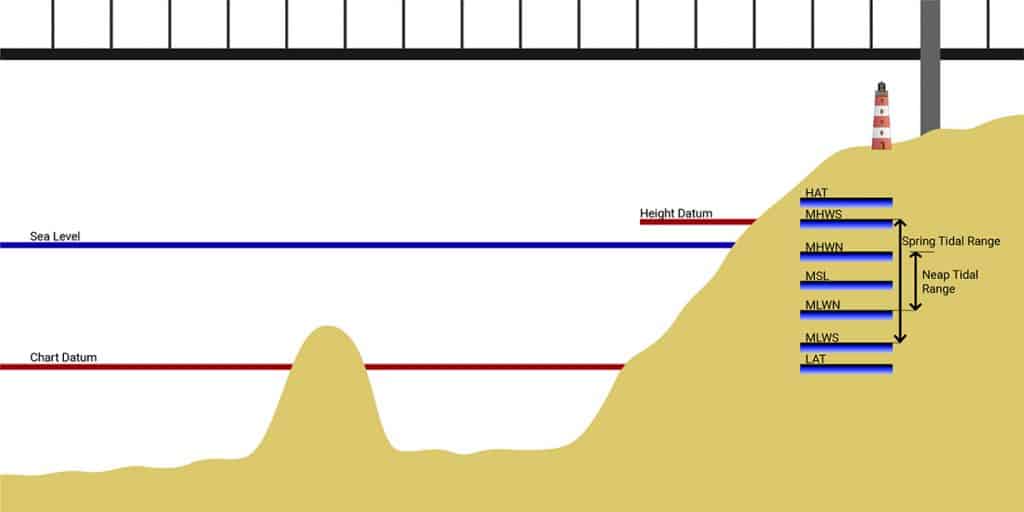
While the datum on a chart is usually written out so that you can read it easily, occasionally you will see an abbreviated version instead.
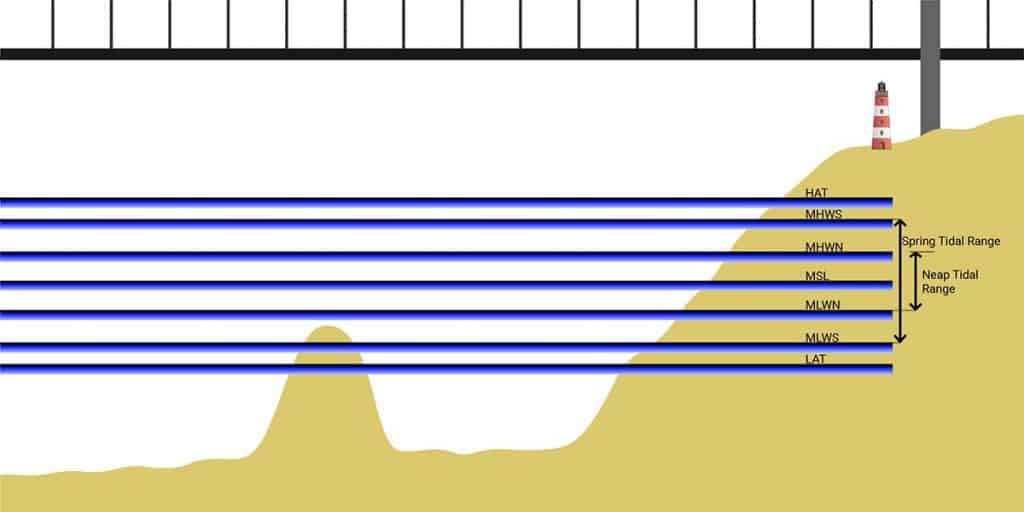
In the image above, you can see a series of common abbreviations. For example, LAT or “Lowest Astronomical Tide”, which is a common datum used on nautical charts.
Others are used for various things, some of which we will get to later in this article.
| Abbreviation | Definition |
|---|---|
| HAT | Highest Astronomical Tide – the highest tide you can expect due to astronomical effects alone. |
| LAT | Lowest Astronomical Tide – the lowest tide you can expect due to astronomical effects alone. |
| MHWS | Mean High Water Springs – the average height of spring high waters. |
| MLWS | Mean Low Water Springs – the average height of spring low waters. |
| MHWN | Mean High Water Neaps – the average height of neap high waters. |
| MLWN | Mean Low Water Neaps – the average height of neap low waters. |
| MSL | Mean Sea Level – the average sea level. |
| MLLW | Mean Lower Low Water – the average height of the lowest tides. |
Common Chart Datums
Out of the abbreviations described in the previous section, three are commonly used as the sounding datum on a nautical chart: LAT, MSL, and MLLW.
LAT (Lowest Astronomical Tide)
Lowest Astronomical Tide is the lowest level that the tide is expected to reach due to astronomical conditions alone.
The tide may reach lower levels due to meteorological effects such as low-pressure systems, but that would not be predicted on tide tables.
The advantage of using LAT is that all tidal heights will be positive, so you know you will always be adding tide to charted heights, without needing to clarify the sign every time.
MSL (Mean Sea Level)
In areas with negligible tide, Mean Sea Level may be used as an appropriate chart datum.
In these areas, you usually do not need to apply tidal predictions to charted depths because any increase in water level due to the height of tide is assumed to be negligible.
MLLW (Mean Lower Low Water)
Mean Lower Low Water is the average height of the lowest tides recorded over a predetermined period, usually around 19 years.
As it is an average, however, you can expect that there will be occasions when the tide will be below the datum level. This means that you always need to check whether tides are positive or negative, especially around low water.
Depths & Drying Heights
The main reason for establishing a datum on a nautical chart is to give you a consistent reference point from which to measure soundings.
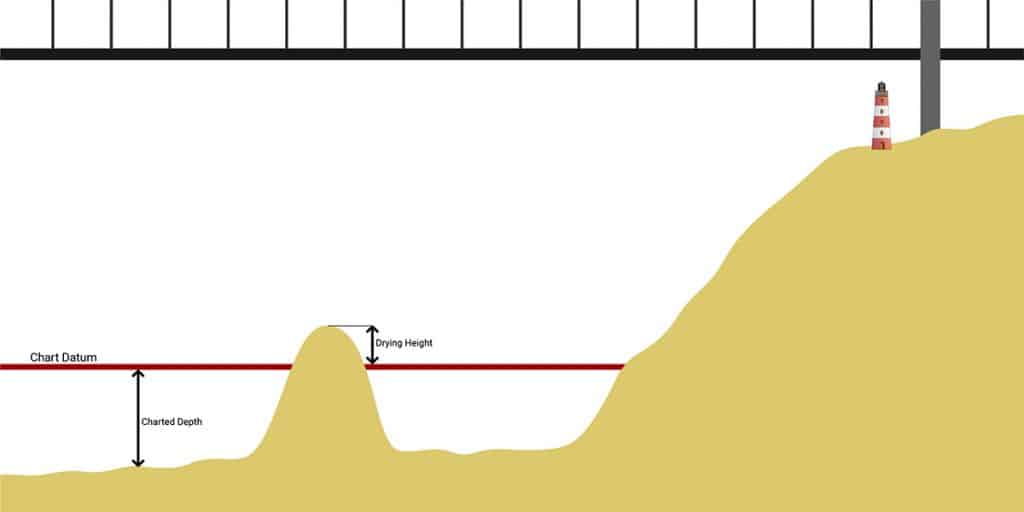
A Charted Depth is the distance from the chart datum, down to the seabed.
A Drying Height is the distance from the chart datum, to the top of a protrusion extending above the datum.
Importantly, charted depths and drying heights both reference the sea floor, even if part of the seafloor is exposed at some point during the tidal cycle.
Consider a beach that gets covered by the tide at high water. On a chart it would be indicated with a drying height, telling you that the seafloor is located above the chart’s datum. You then need to work out the height of the tide to determine how much of it will be covered at high water.
Pro Tip: Drying Heights (which reference the sea floor) are different to Charted Heights (which reference tall structures). You can find more information about Charted Heights below.
Effect of Tide
With an understanding of how chart datum is used as a consistent reference point for measuring the seafloor, we can then start to observe the effect of the tide.
Pro Tip: Ensure your tide tables are using the same datum as your chart.
Using tide tables or other tidal predictions, you simply apply the tide above chart datum.
As we are usually interested in the actual depth of water, we want to calculate the “Observed Depth”. The calculation is slightly different depending on whether you are using a charted depth or a drying height, but the principle is the same.
Observed Depth = Charted Depth + Height of Tide
Observed Depth = Height of Tide – Drying Height
The simplest way is to remember the image above, then you will always be able to calculate your observed depth correctly.
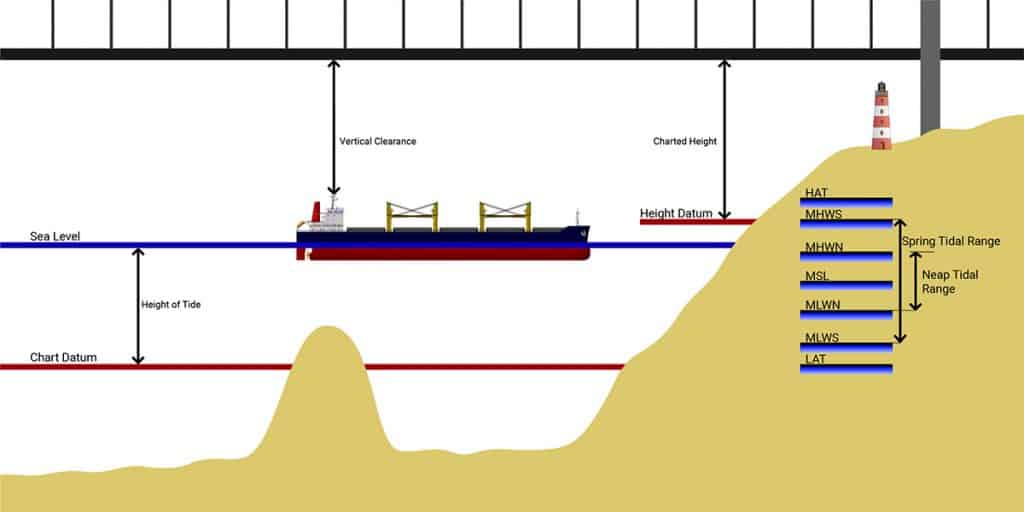
Measuring Heights on a Nautical Chart
While chart datum is an ideal reference point for measuring soundings across a chart, it is not used for measuring heights.
Instead, we use a separate height datum, which you will find detailed on the chart itself.
The image above shows that the datum is “Mean High Water”, but other common datums for height include “Mean High Water Springs”, “Highest Astronomical Tide”, or “Mean Sea Level”.
As the most common one that I have seen personally, I like to reference MHWS.
Once you have identified the height datum, it works in the same way as chart datum.
Where the chart datum is used for soundings, the height datum is used for heights and elevations.
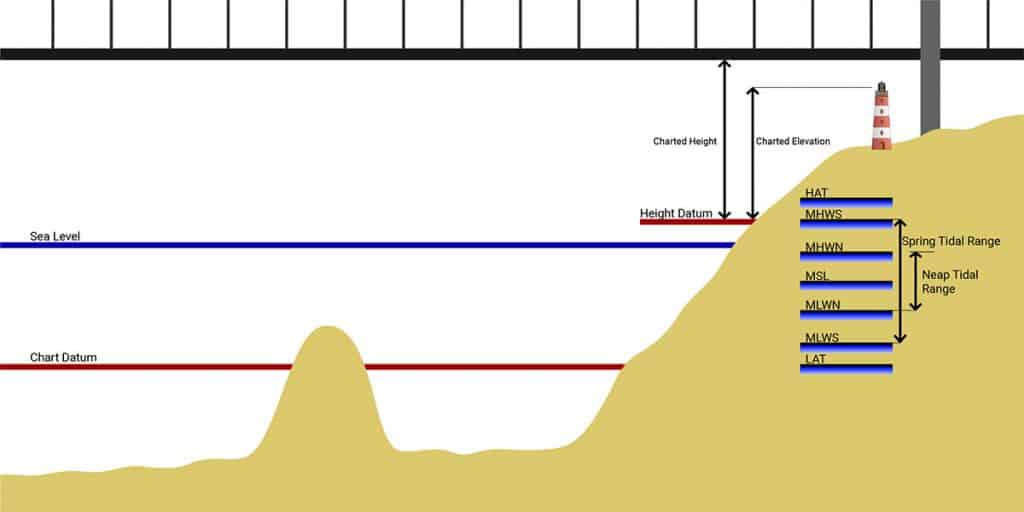
A Charted Height is used for things like bridges and cables and tells you the clearance between the height datum and the referenced object.
A Charted Elevation is used for things like lights and tells you the distance between the height datum and the focal plane of the light.
Calculating Vertical Clearance
In navigation, charted heights are most commonly used when you need to calculate the vertical clearance between a vessel and an overhead obstruction.
The easiest way to approach this sort of calculation is to draw a diagram.
The first step is to calculate the height of the charted object above chart datum, which involves re-writing the height datum in terms of the chart datum. In this case, we know that the height datum is MHWS, so we need to look in our tidal information to get that.
Height Above Chart Datum = MHWS + Charted Height
Next, we need to calculate the highest point of our vessel above chart datum.
Highest Point of Vessel Above Chart Datum = Height of Tide + Airdraft
On vessels with a consistent draft, the airdraft will also be consistent so you can read it straight from your information documents.
Finally, to find the clearance, you simply subtract one from the other:
Vertical Clearance = Height of Bridge – Highest Point of Vessel
It might seem that using different datums has complicated things somewhat, but there is a very good reason why.
Why Are Heights Not Measured From Chart Datum?
The reason heights and soundings are measured from different datums is that it allows you to safely use a nautical chart with no knowledge of the tide.
Soundings are measured from chart datum, which is usually the lowest level you can expect the tide to reach. This means that any amount of tide should increase the depth of water, making it safer for navigation.
Similarly, heights are measured from the height datum, which is set around the highest level that you would expect the tide to reach. If you determine that you are safe to pass at the charted height, theoretically any drop in tide is only going to increase your clearance.
It is only when the depth of water or the vertical clearance is looking close that you should need to perform calculations. In those circumstances, the person performing the calculations should be competent enough to apply them correctly.